You can test and debug your GA4 setup using:
- Google Tag Assistant browser tool
- WP FP’s setup mode
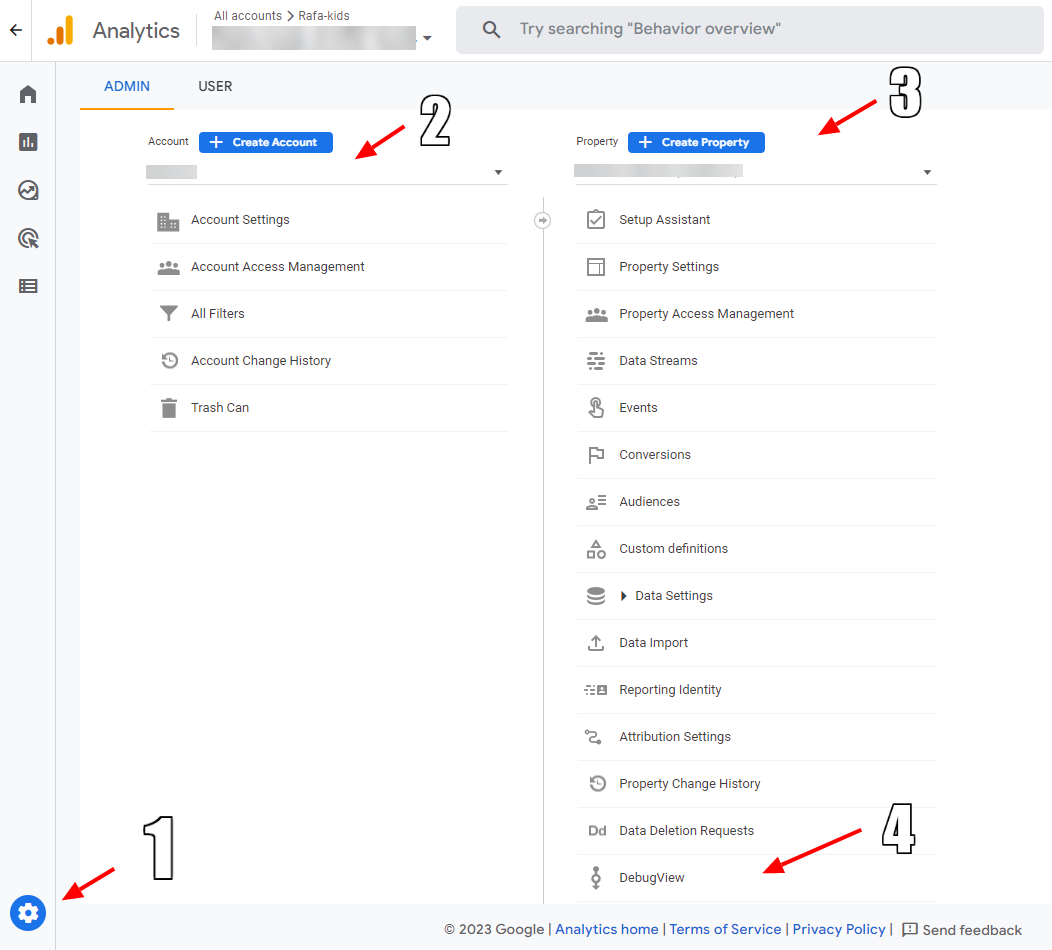
- GA4’s DebugView
This is how you do it.
Method #1 (Recommended). Test GA4 setup with Google Tag Assistant
To debug GA4 with Google Tag Assistant (GTA), you need to:
- Open incognito mode in your browser (best to use in Google Chrome. I experienced issued in other browsers)
- Make sure that your ad blocker is turned off
- Go to Tag Assistant’s website
- Add and verify the domain of your website
GTA will automatically open your website. If you use a cookie notice, you will have to agree to cookies before you will see any data.
Method #2. Test GA4 setup with WP Full Picture’s Setup mode
Attention! This will only allow you to test and debug tracking user actions.
The whole process of using setup mode is described here.
Method #3. Test GA4 setup with the DebugView
Google Analytics 4 has a special debug mode that you can enter and check the data tracked by your integration.
Unfortunately, this view may be problematic to use. This is because the debugging panel refreshes very slowly. I experienced situations when the data showed up even 30 minutes after the moment it should.
If you still want to use it, this is how you do it.
Step 1. Open the incognito mode in your browser and make sure that your ad blocker is turned off.
Step 2. Visit your website through a URL with suffix ?ga4_debug=on
Step 3. Go to your GA admin panel and open DebugView

Step 4. Browse a little and see your traffic in the DebugView. In some extreme situations, it can take up to 30 minutes before you see the data!
Attention for debugging Measurement Protocol!
In WP Full Picture 8.2.0 we have added the support of Measurement Protocol for tracking WooCommerce orders server-side.
During our tests, we noticed, that these orders are not visible in debugView when the debugView mode is enabled. The only way to see them is to wait 24 hours to see orders in your GA reports.
Realtime report is also unreliable for debugging server-side orders, since it often takes Gooogle more than 30 minutes to process them.
